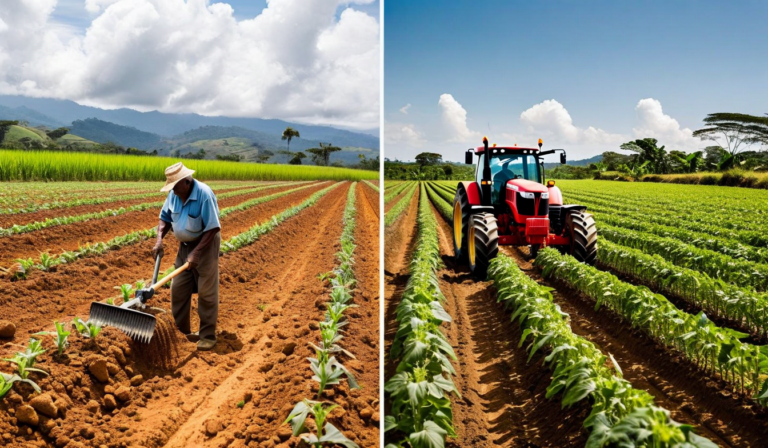
For most of the 2000s and early 2010s, satellite-derived agriculture data was genuinely inaccessible to small farms. Not because the satellites did not exist -- they did -- but because accessing the imagery required purchasing data subscriptions, processing raw raster files, and employing someone who understood geographic information systems. A 10-hectare potato farm in Boyaca had no realistic path to any of it.
That has changed. The European Space Agency's Sentinel-2 program made high-resolution multispectral imagery freely available. Compute costs for processing it dropped by orders of magnitude. What remains is the work of building software that translates raw satellite data into something a farmer can actually read. That translation layer is where the practical access barrier now sits -- and where it is being addressed.
What Resolution You Actually Get
Sentinel-2 delivers imagery at 10-meter ground resolution in its primary bands. That means each pixel in the processed image represents a 10-by-10 meter square on the ground. For a 10-hectare farm, that is roughly 1,000 pixels covering your entire field. Enough to see zones of variation, detect patterns, and identify anomalies -- but not enough to pinpoint a single sick plant.
Commercial satellite providers offer 30-centimeter or even sub-10-centimeter resolution, but at a cost that excludes most small farms. The 10-meter Sentinel-2 data hits a useful practical floor: it is coarse enough to process at scale and fine enough to matter for field-level decisions on farms above 3 hectares.
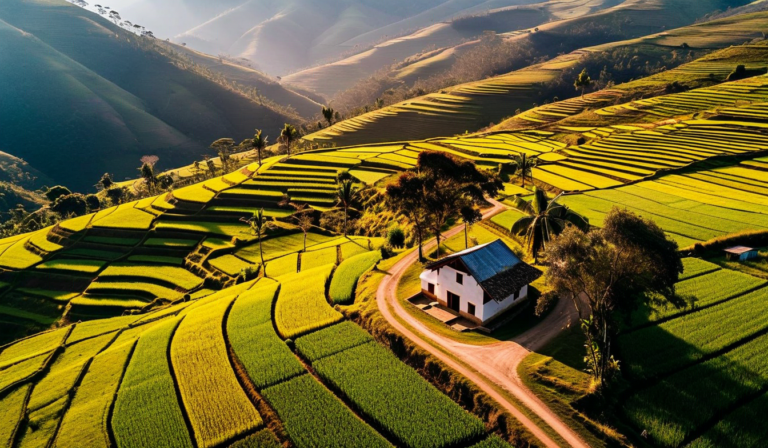
What a 10-Hectare Farm in Boyaca Can Actually See
Satellite monitoring at this resolution reveals several categories of information that field walking alone misses or catches too late:
- Stressed zones: Areas where plants are reflecting light differently from the rest of the field -- often indicating water stress, nutrient deficiency, or early pest pressure before visual symptoms appear
- Crop density variation: Sections with lower plant cover than expected for the growth stage, which can indicate poor germination, soil compaction, or drainage problems
- Boundary changes: Shifts in vegetation health near field edges, access roads, or water sources that may indicate runoff, shading, or compaction from machinery
- Temporal change: How the same field looked 5, 10, or 30 days ago, compared to now -- trend data that a single field walk cannot produce
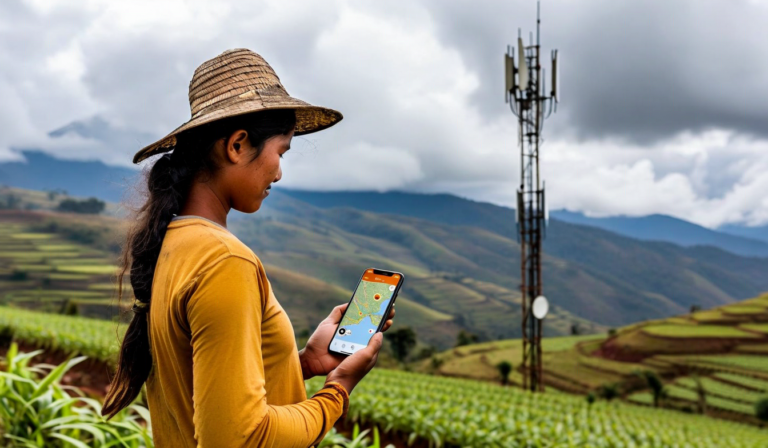
Imagery updates every 5 days under normal cloud conditions. In Colombia's highland zones, cloud cover can extend that gap, but the system uses multiple passes and partial-coverage composites to fill gaps where possible.
Reading the Vegetation Map Without the Jargon
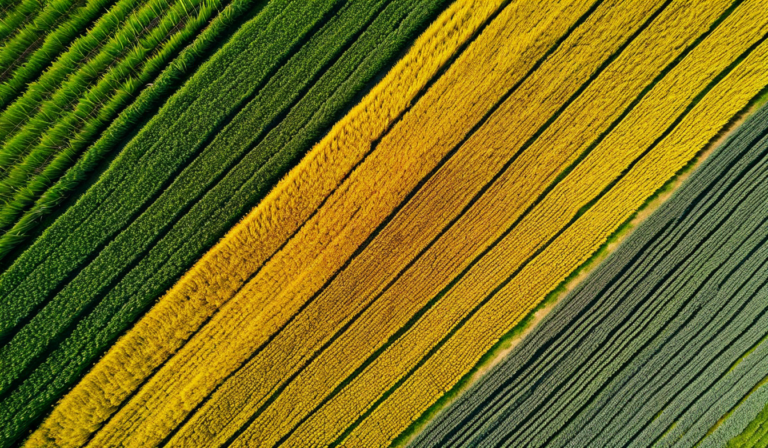
The vegetation health map displayed in Sioma is derived from a calculation that compares how strongly different parts of your field are reflecting near-infrared light versus red light. Healthy green plants absorb red light for photosynthesis and reflect near-infrared strongly. Plants under stress do the opposite: they reflect more red and less near-infrared.
The result is a score for each pixel that runs from deep green (healthy, high photosynthetic activity) to yellow and red (stressed, low activity). You do not need to know the underlying formula. What you need to know is: green is good, yellow warrants attention, red zones need a field visit within 48 hours.
A Leaking Irrigation Pipe, Found from Space
A potato farm outside Tunja had been experiencing below-average yields in one quadrant of the main field for two consecutive seasons. The farm's irrigation system ran underground laterals across the field. On a standard field inspection, everything looked normal -- the soil surface was moist, the plants were not visibly wilting.
The satellite vegetation map told a different story. A linear band of unusually high vegetation density -- plants that were greener and taller than the surrounding crop -- ran diagonally across the underperforming quadrant. That pattern does not occur naturally in a uniform field. A targeted inspection of that specific line found a slow leak in a lateral pipe that had been over-watering a narrow strip while leaving the adjacent zones dry. The over-watered strip showed excessive vegetative growth at the expense of tuber development. The adjacent dry zones were the actual yield problem.
Two seasons of yield loss traced to a faulty pipe fitting. A physical inspection had not caught it because the surface cues pointed nowhere in particular. The satellite view, which shows the entire field at once and highlights spatial anomalies, made the linear pattern immediately obvious.
The Practical Shift
Satellite monitoring does not replace walking your fields. It changes how you walk them -- you arrive with a specific map showing which zones need attention, rather than covering the whole field hoping to notice something. On a 10-hectare farm, that difference is a few hours. On a 50-hectare operation across multiple plots, it is the difference between catching a problem in time and finding it after the damage is done.